Entropy & The Second Law
- Engineering

- Oct 22, 2020
- 4 min read
Updated: Apr 11, 2021
In this notes sheet...
As seen in the notes sheet on the second law, we can compare a heat engine’s actual efficiency with that of its reversible counterpart. If we want to compare these in greater detail, we need to use entropy.
The Clausius Inequality
In the notes sheet on the second law, we looked at heat engine connected to two thermal reservoirs, modelling two heat transfers only:

In reality, however, this is not the case. Instead, each of these heat transfers occurs in infinitely many infinitesimally small steps, dQ:

We can integrate to sum the total positive and negative heat transfers in one complete cycle:

However, this on its own is not particularly helpful. Instead, we want to be able to find the heat transfer at a specific temperature. Therefore, the Clausius inequality looks at Q/T instead:

Reversible Cycles
The Carnot cycle is the ideal reversible cycle:
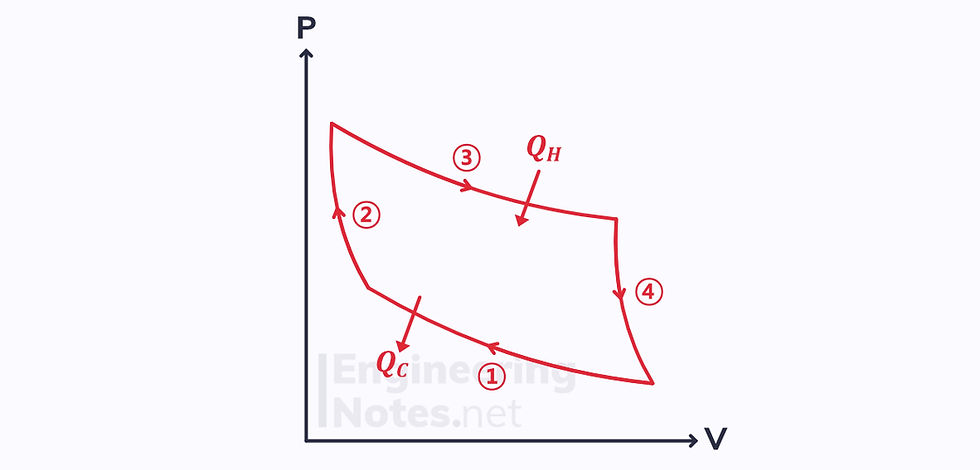
Applying the Clausius inequality:
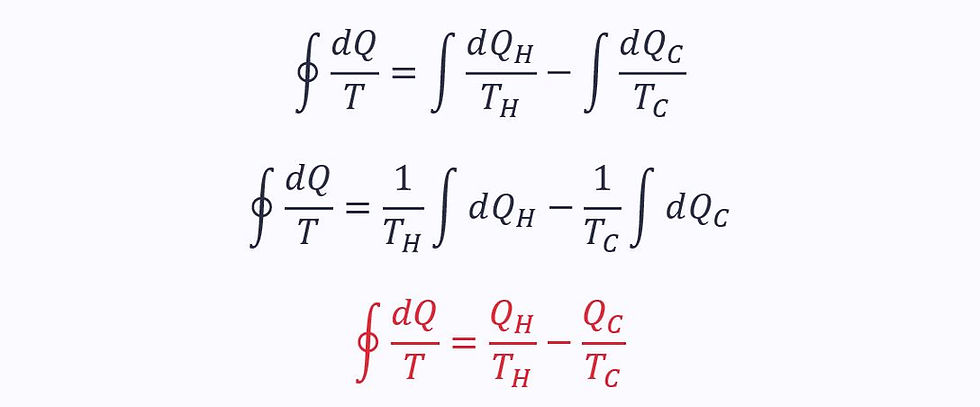
Since the process is reversible, the two ratios must equal each other. Therefore, for a reversible process:

Irreversible Cycles
We know that the efficiency of the reversible engine is greater than that of the irreversible one, so the heat output of the irreversible engine is greater than that of the reversible:
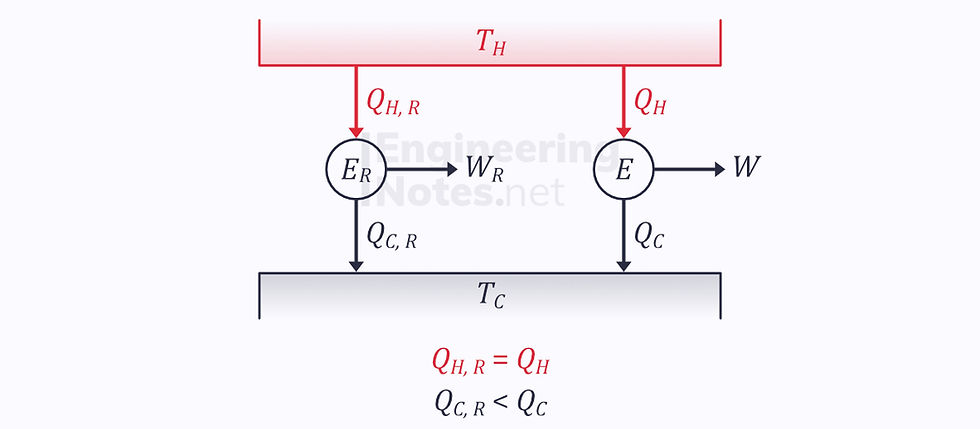
This means that

But since they are both taking heat from the same hot reservoir:

Therefore, plugging these into the equation derived above:

We find that for an irreversible cycle:

Entropy
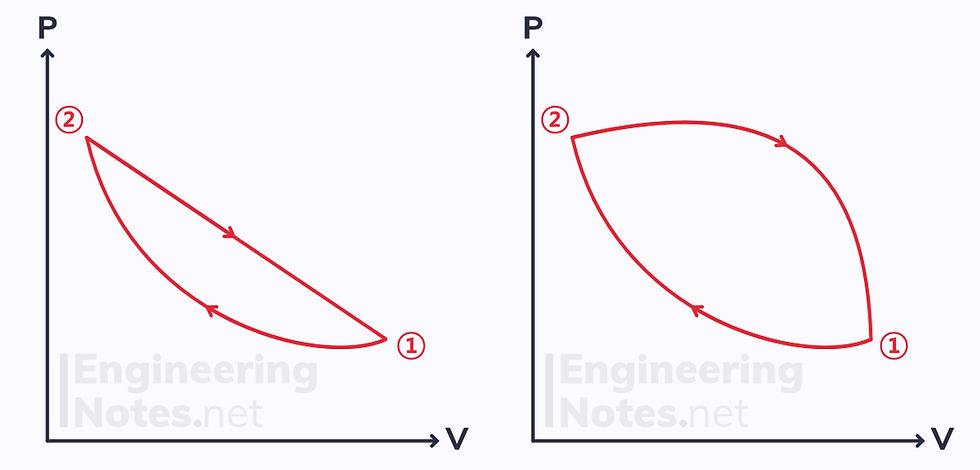
Applying Clausius’ inequality to the two reversible cycles shown above shows that the integral of dQ/T equals zero in both. This means that the change in Q/T is path independent: it is a property.
This property is called entropy, S, and the change in it is given as:

The units of entropy are J/K – Joules per Kelvin
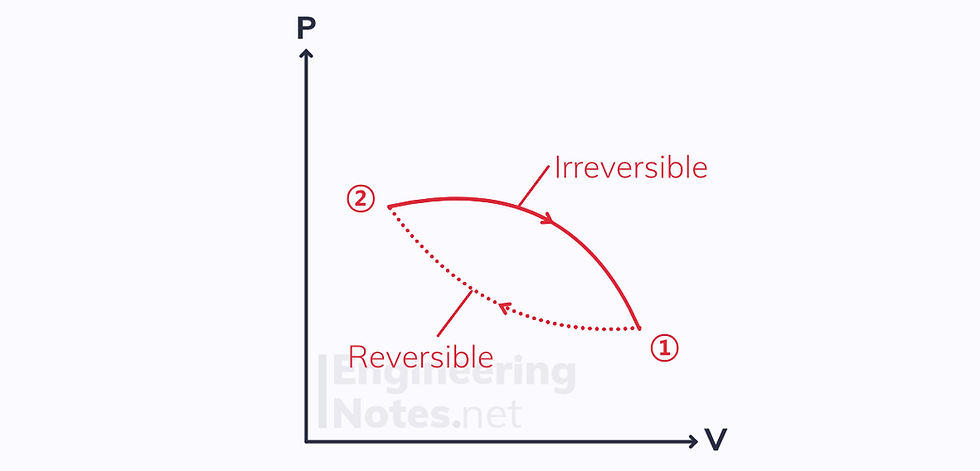
If we take a cycle with one reversible and one irreversible process, we know the total change in entropy must be negative (see Clausius’ inequality above):

The right-hand side is the definition of change in enthalpy, so:

Whenever an irreversible process occurs, the enthalpy increases. The entropy in the system itself may decrease, but then that of the surroundings will increase significantly more.
Temperature-Entropy Diagrams
The area under a reversible temperature-entropy curve is the heat transfer that takes place in that process:

Adiabatic Process
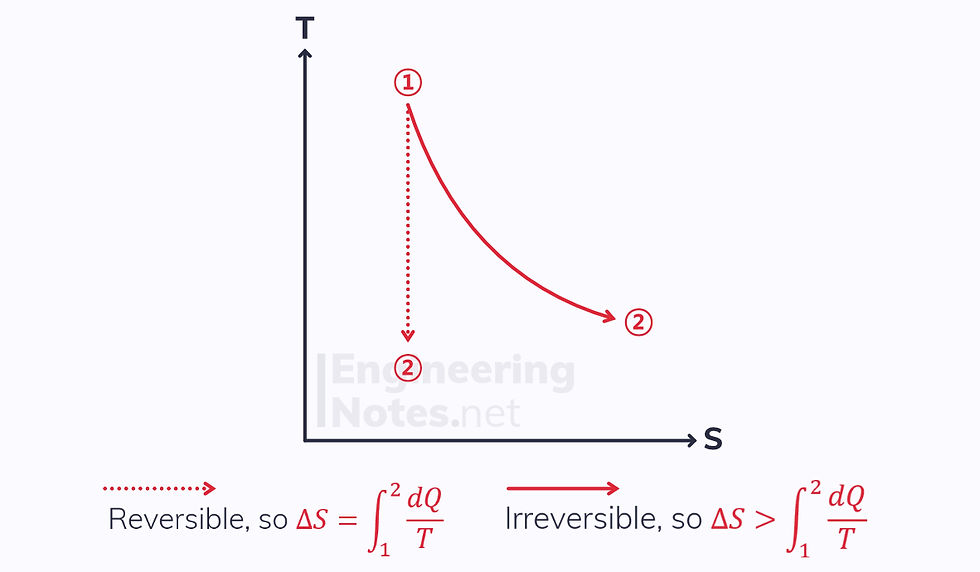

The reversible process is isentropic, as its enthalpy change equals its heat transfer, zero
The irreversible process experiences an increase in entropy.
Heat Addition
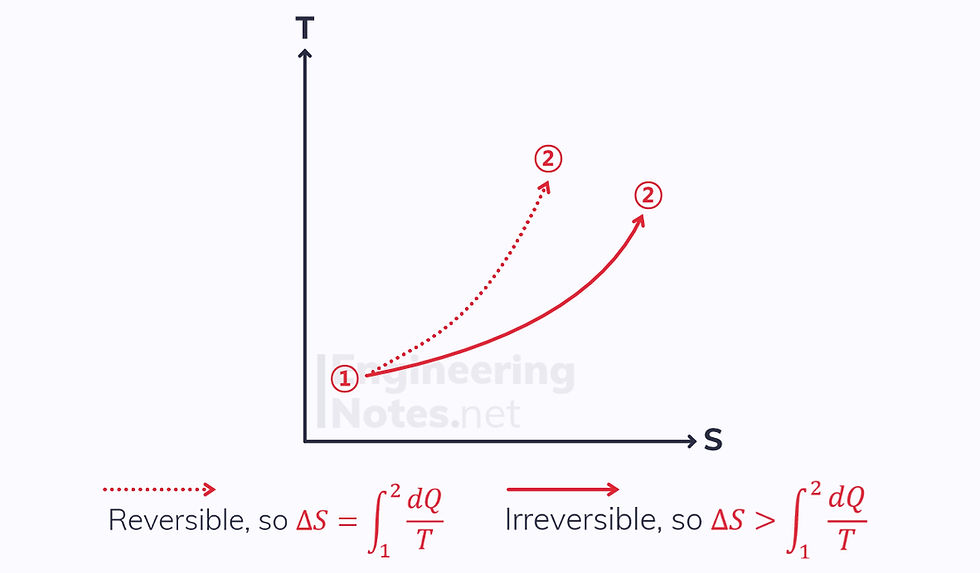
The Process is not adiabatic, so there is a heat transfer to the system.
Both the reversible and irreversible processes increase in entropy.
The irreversible process increases more in entropy.
Heat Rejection
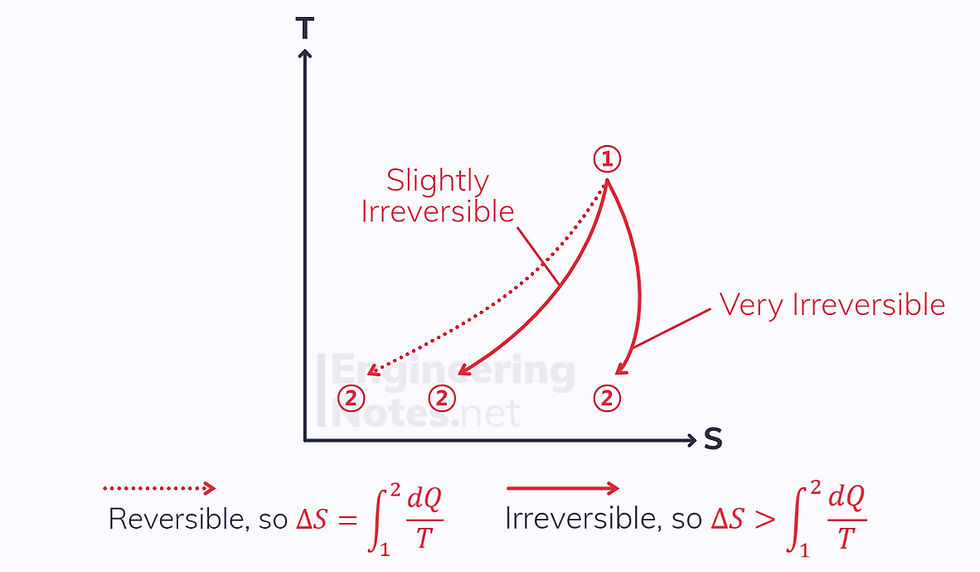
There is a negative heat transfer in heat rejection
This means the change in entropy for a reversible process will also be negative
The change in entropy for the irreversible process could be either positive or negative, depending on how irreversible it is
Carnot Cycle
The Carnot cycle is a rectangle on a T-S diagram:
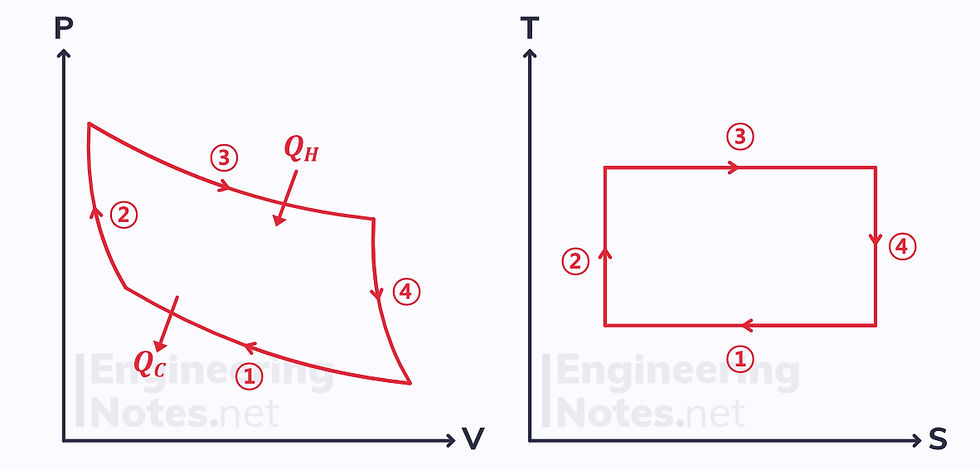
Isothermal & reversible heat rejection, so reduction in entropy.
Adiabatic & reversible, so isentropic. Temperature increases.
Isothermal & reversible heat addition, so increase in entropy.
Adiabatic & reversible, so isentropic. Temperature decreases.
Combining First & Second Laws
According to the first law, for a smaller part of a reversible process:

Taking the heat transfer as the area under the T-S graph and work as the area under the P-V diagram:

This equation applies to both reversible and irreversible processes.
Alternatively, we can rewrite the first law in terms of enthalpy:

This equation also applies to both reversible and irreversible processes.
Isothermal, Reversible Processes
In an isothermal process, the first law becomes:

Applying this to the equation for the change in entropy in a reversible process:

Substituting in the ideal gas law (Pv = RT):

This only applies to reversible, isothermal processes
Perfect Gas Processes
For an ideal gas:

For a perfect gas, Cv is constant. Therefore, the integrated entropy equation becomes:

This can alternatively be expressed in terms of temperature and pressure:

Or in terms of pressure and volume:

Isentropic Processes
For an isentropic (reversible, adiabatic) process, setting the left-hand side to zero shows us that:

All of these equations only apply to perfect gasses. For steam, see below.
Isentropic (Adiabatic) Efficiency
In an adiabatic process, such as a turbine, compressor or pump, the ideal reversible efficiency is that of the isentropic process.
Turbine Efficiency
For a turbine, the ideal process is a vertical line downwards on an enthalpy-entropy diagram, whereas the actual process is a diagonal:
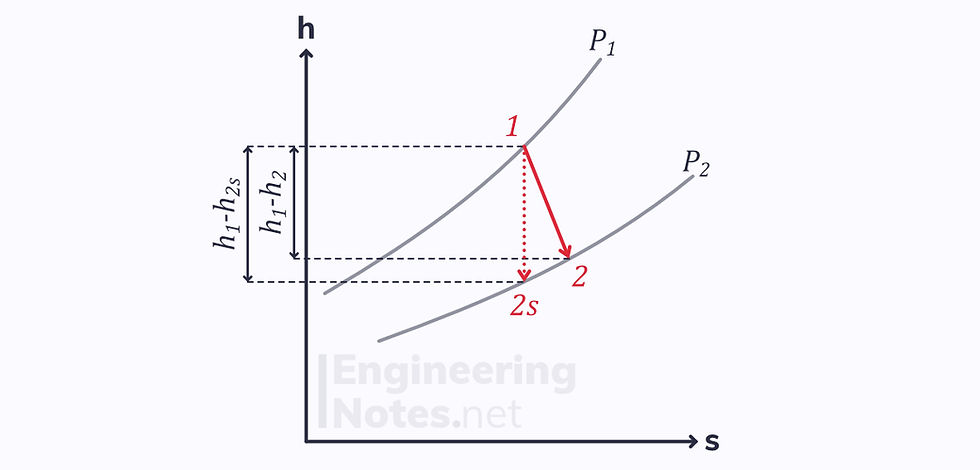
Since the end points of both processes (reversible and irreversible) are on the same isobar, there is a difference in enthalpy.
This gives the isentropic efficiency:

Compressor/Pump Efficiency
For a compressor or pump, the directions are reversed:
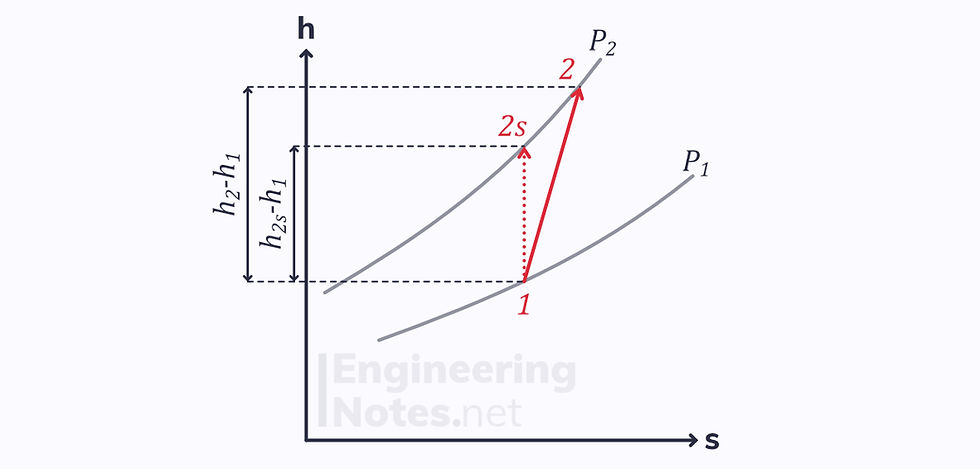
Therefore the isentropic efficiency is given as:

Entropy & Steam
T-s Diagram for Steam
Similar to the vapour dome, the T-s diagram for steam is bell-shaped:
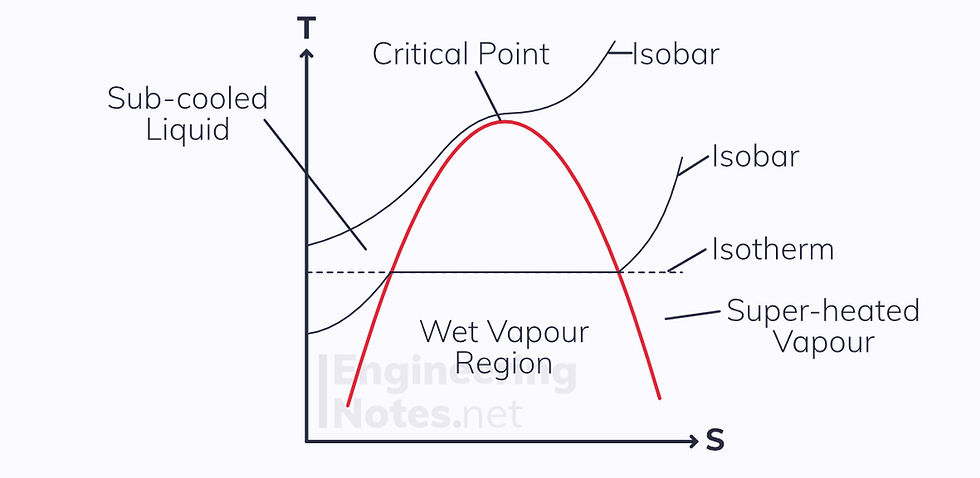
The isobars inside the dome are the same as the isotherms
Pressure increases diagonally from bottom right to top left
To find the limits of the dome at each temperature/pressure, steam tables need to be used
Interpolation is used to find the quality of the wet steam, just like dryness fraction.
h-s Diagram for Steam
This is an odd one. There are some similarities to the T-s diagram above, but not many:
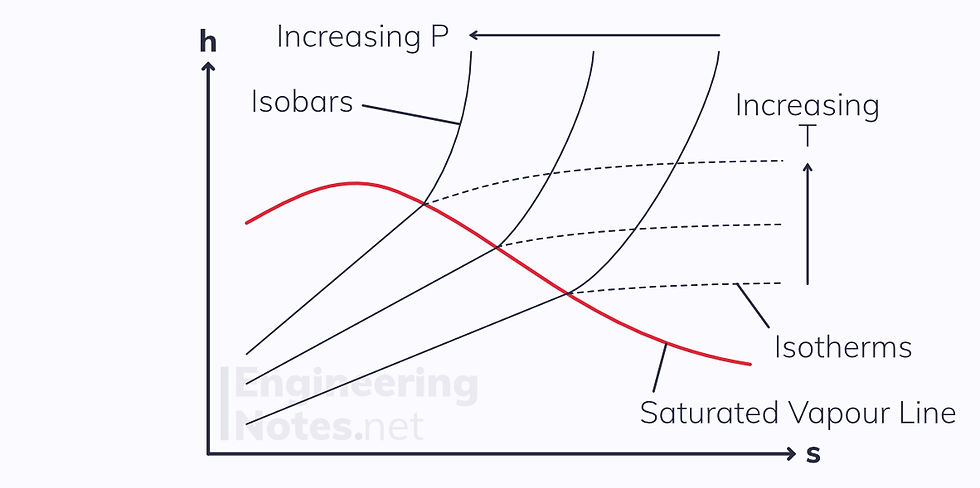
The critical point is not on the top of the curve, it is far on the left (not even shown on this diagram).
This means the sub-cooled liquid region is rarely seen
Isobars and isotherms are not horizontal in the wet vapour region, but are diagonal straight lines
Isobars in the superheated vapour region are curved
As s increases far beyond the wet vapour region, isotherms become near horizontal (the steam comes close to being an ideal gas at high entropies)

Comments