Astrophysics
- A-Level Physics

- Aug 5, 2020
- 6 min read
Updated: Dec 7, 2020
The universe is everything that exists. It contains many galaxies (ours is the Milky Way) that are clusters of stars and planets. Within galaxies, there are many solar systems. These contain one star, the planets that orbit this star, the planetary satellites (such as moons or artificially launched satellites), asteroids, and comets.
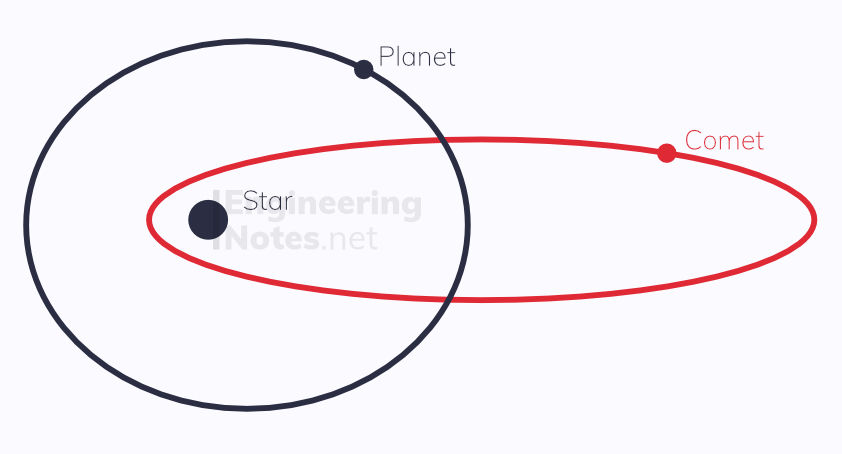
According to Kepler's first law, all objects have elliptical orbits. However, planets tend to be more on the circular side, whereas comets have intensely elliptical orbits.
Life Cycle of Stars
Formation of Stars
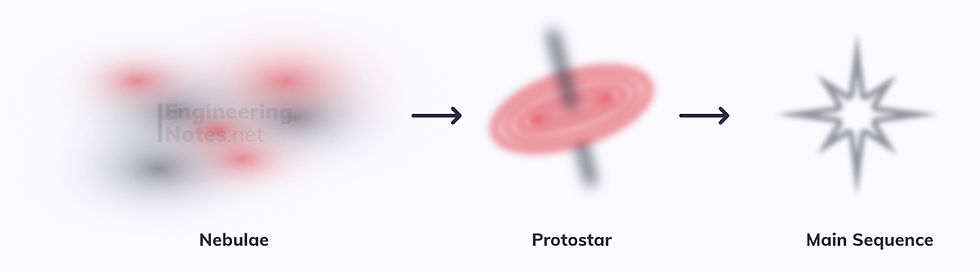
Nebulae - Stars form when nebulae (large clouds of gas and interstellar dust) slowly contract under gravitational forces.
Protostars - When the cloud of dust gets dense enough, it splits up into protostars. The loss in gravitational potential energy in bringing all the dust/gas together causes the protostar to heat up.
Fusion - Eventually the protostar becomes hot enough for fusion to occur (a few million degrees), where hydrogen nuclei combine to form helium.
Main Sequence - The process of fusion releases a vast amount energy, keeping the core of the star hot until it has burnt through all the hydrogen fuel. This phase is relatively stable, because while the gravitational force acts to compress the star further, the radiation pressure from the emitted photons and the pressure of the gas push outwards.
Main Sequence
The lifetime of a star depends on its mass: a larger star burns through its fuel much faster than smaller stars. The threshold for small and large stars is the Chandrasekhar limit (around 1.4 solar masses) - it is the maximum mass for which electron degeneracy pressure (that keeps the star going) can counteract the gravitational force (that tries to collapse the star).
Low Mass Stars have a core mass of up to 1.4 solar masses (the mass of the sun), and a lifetime of five to ten billion years.
Massive Stars have cores heavier than 1.4 solar masses and a lifespan of just a few hundred-thousand years.
After the main sequence, the star enters the final phase. Again, this is dependent on the size of a star.
Death of a Low Mass Star
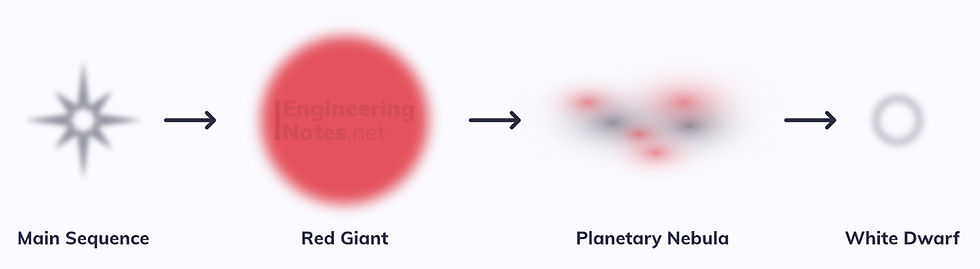
Becomes a Red Giant: as the fuel runs out, there is less energy opposing gravity, so the core pulls into itself, heating up.
Before the core can contract completely, there is enough energy for the helium atoms start to combine to form carbon and oxygen atoms. This process also emits a huge amount of radiation, and prevents the star from collapsing completely, and actually forces the outermost layers of the star out, making it bigger than it was in its normal phase. Because it is larger for the same material, its heat is spread out over a larger surface area: this is why it appears redder.
Eventually, the helium fuel runs out, however there will never be enough energy for carbon and oxygen to fuse.
Initially, the gravitational forces pull the star in on itself once again, however the helium still in the shell will continue to undergo thermonuclear reactions. This provides more energy than the force of gravity, and so the shell separates further and further from the core, causing clouds of glowing gas, ionised by the UV radiation from the core. This is known as a planetary nebula.
The exposed core is known as a white dwarf and is immensely dense – over a tonne per teaspoon.
Once it reaches about earth size, the electron degeneracy pressure (the pressure exerted by the electrons) stop it collapsing any more. These last for billions of years and slowly cool down and become dimmer, before eventually becoming a black dwarf – the corpse of a past small star.
Death of a Massive Star
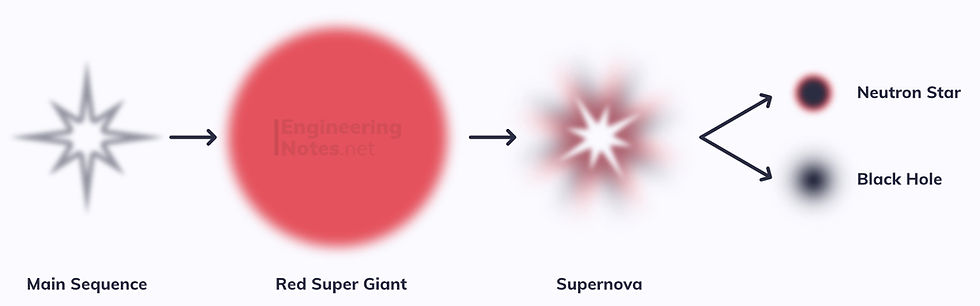
Similar to the break down of a small star, as the hydrogen fuel runs out, helium becomes the fuel.
Initially the star contracts and then expands far beyond its initial size. However, they are far bigger: Red Supergiants can have a radius up to 1500 times larger than the sun, whereas a normal reg giant would only be 200-800 times larger.
At the end of the red supergiant phase, once all the helium fuel has been used up and fused into carbon and oxygen, the star pulls in on itself.
No nebula forms as the outer shell of the star is pulled all the way in instead of separating. As this happens, the star becomes denser and denser until it cannot withstand its own gravitational force.
The whole core collapses, resulting in an explosion into a supernova. This leaves behind one of two things:
A Neutron Star: this is similar to a white dwarf – the immensely dense core left behind – held only together by neutron degeneracy as thermal energy is not enough to overcome gravity. They are only about 20km in diameter, and spin up to 600 times a second (called Pulsars). They emit radio waves in two beams as the rotate that sometimes sweep past the earth as radio pulses. This forms when the core mass is 1.4 – 3 solar masses.
A Black Hole: If neutron degeneracy is not sufficient to overcome gravity, the star will continue to collapse into a point of singularity: an infinitely small, infinitely dense point. This becomes the centre of a black hole. Around the black hole is a region where the gravitational pull is so strong that even light is sucked in – the boundary of this region is called the event horizon. This forms when the core mass is >3 solar masses.
Luminosity
Luminosity is the measure of how bright an object is, and for stars, this can be plotted against temperature on a Hertzprung-Russell diagram:

The main sequence, red giants, super giants and white dwarfs can be plotted in different areas on these graphs because they are so stable and last such a long period of time. You do not plot transitional stars as the transitions are so rapid.
Electromagnetic Radiation from Stars
In isolated gas atoms, electrons can only exist within certain well-defined energy levels, where n=1 is the ground state. Electrons can move down energy levels by emitting a photon, hence the energy levels have negative values.
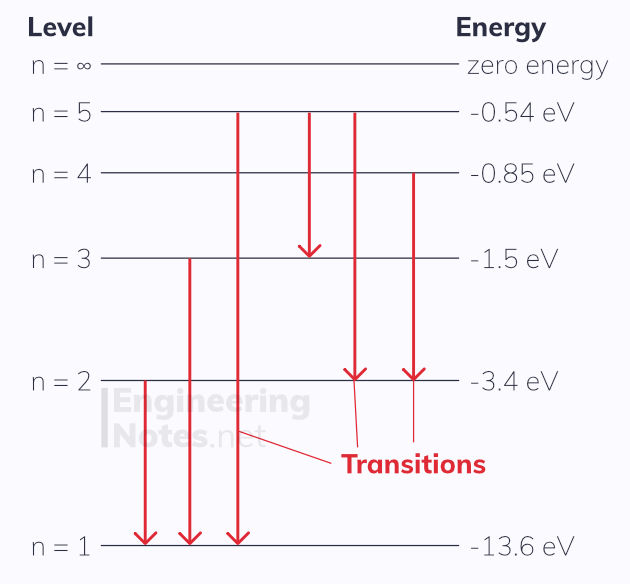
The difference in energy between the levels is equal to the energy of the emitted photon:
E = hf difference in energy = Planck constant x frequency
Using the wave equation, v = fλ, we can rewrite this as:
E = hc/λ difference in energy = Planck constant x speed of light / wavelength
As gasses are heated, many electrons will move into higher energy levels. When they fall back down to the ground state, photons are emitted. Using a diffraction grating, this emitted light can be separated into an emission line spectrum, where each line corresponds to a certain wavelength of emitted light brought about by the corresponding energy change.
Different atoms have different discrete energy levels, and as such produce different spectral lines. This can be used to identify elements within stars.
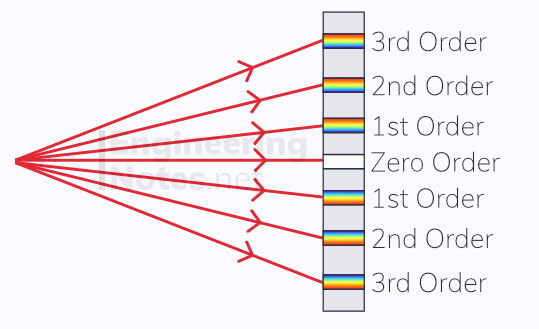
Continuous Spectra contain all possible wavelengths – e.g. the spectrum of white light. When white light is shone through a diffraction grating, each order has a spectrum as each wavelength of light within the white light is diffracted by a different amount. Red is always on the outside, and violet on the inside. The zero order remains white, as the waves just pass straight through without being diffracted.
Hot objects emit continuous spectra in the visible and infrared regions. Extremely hot objects may also reach shorter wavelengths, like the ultraviolet region.
Emission and Absorption Line Spectra

Emission Line Spectra show the wavelengths of the emitted photons as lines, when passed through a diffraction grating. They form when a cloud of gas is excited (heated up). When this happens, electrons move up into higher energy levels. As the gas cools, the electrons fall back down into lower levels, releasing the energy as photons. The lines on the emission spectra correspond to the wavelengths of these emitted photons.
Absorption Line Spectra are the exact opposite to their corresponding emission line spectrum. When light with a continuous spectrum of energy pass through a cold gas, electrons in their ground states are excited by photons of the correct wavelengths. These wavelengths are then missing from the continuous spectrum, leaving black lines. Light emitted from stars has to travel through a large amount of gas at its surface before travelling to earth, which absorbs particular wavelengths, leaving behind an absorption spectrum.
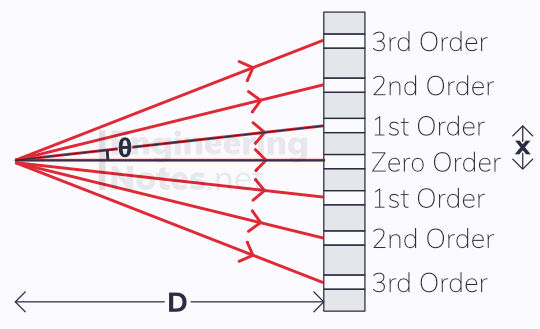
The wavelengths can be calculated with the angle from the zero-order line (see section on waves and diffraction gratings) using the equation:
d sinθ = nλ slit separation x sin(angle of diffraction) = order number x wavelength
To calculate θ, we can apply the small angle approximation, tanθ ≈ θ:
θ = x/D angle = fringe separation / grating-to-screen distance
Wien's Law
As the surface temperature of a star increases, the most common wavelength emitted becomes shorter. This is known as the peak wavelength, λ(max).
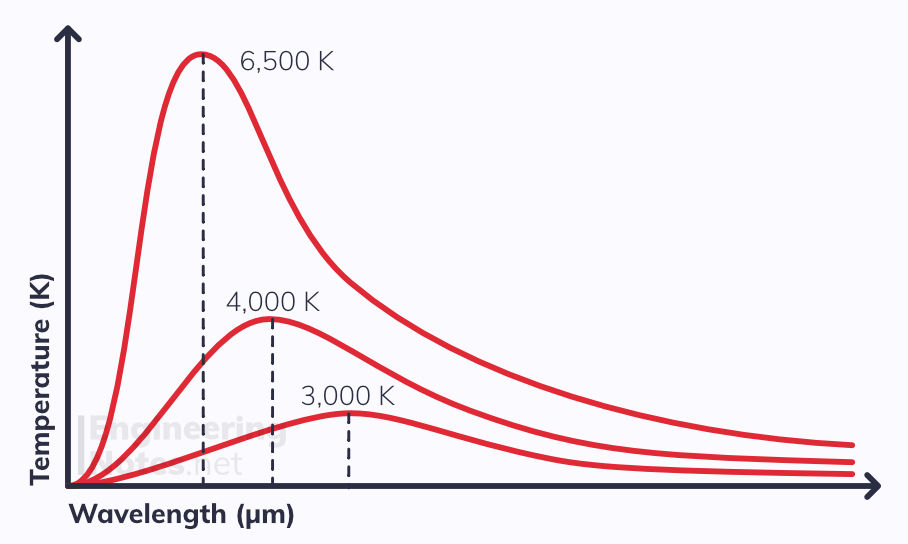
Wien’s Displacement Law can be used to estimate a star’s peak surface temperature, in kelvin:
λ(max) ∝ 1/T
Stephan's Law
The luminosity of a star is defined as the total energy the star emits per second – its power output. It depends on temperature, as well as surface area and can be calculated using Stefan’s Law:
L = 4πr²σT⁴ Luminosity = 4π x radius² x the Stephan Constant x Temperature⁴
The Stefan constant is taken as 5.67 E-8 Wm-² K-⁴


Comments